|
|
NLO gg→H total cross sections vs. MH at 7 TeV.
Each .png figure is linked to a .eps version.
Left plots: 68% C.L. Right plots: 90% C.L.
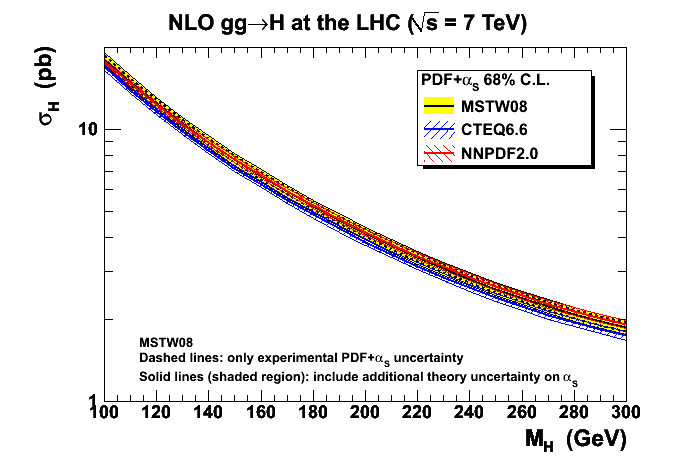
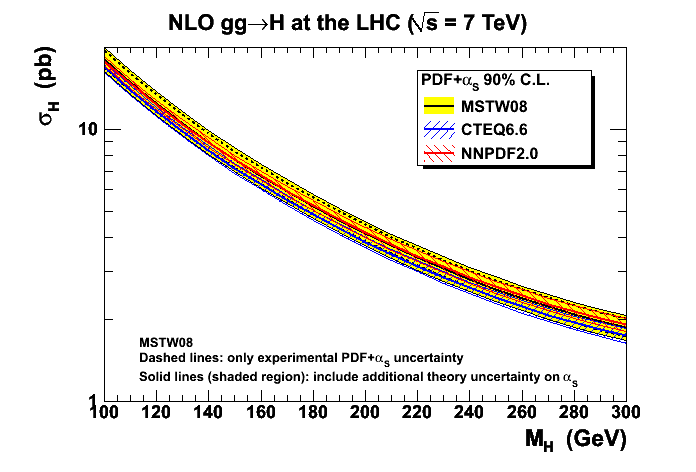
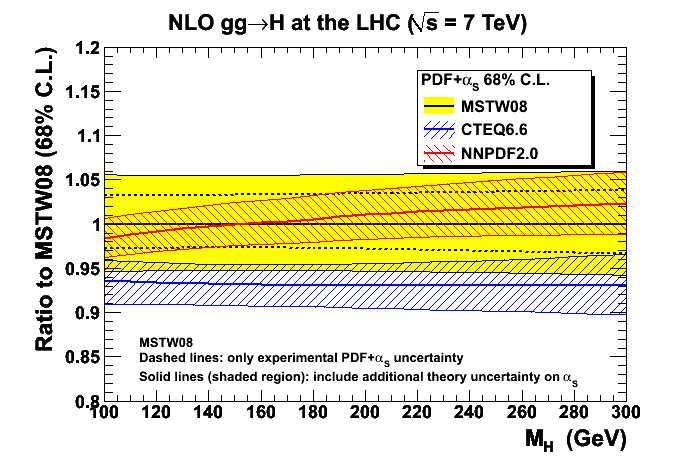
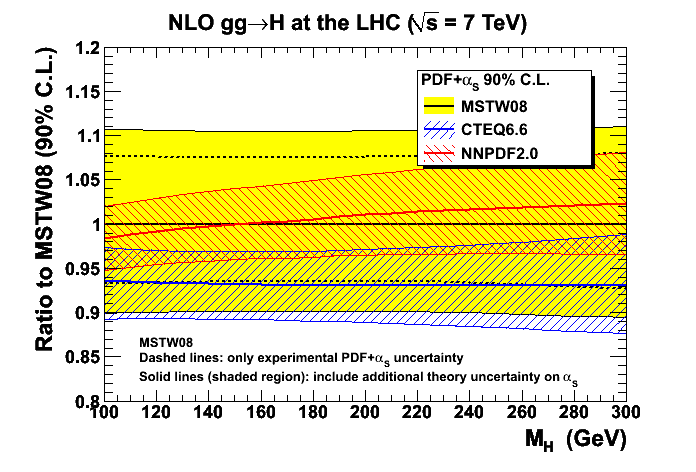
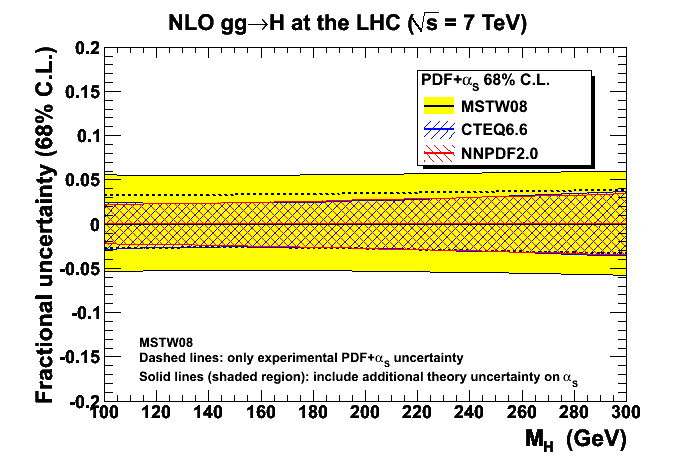
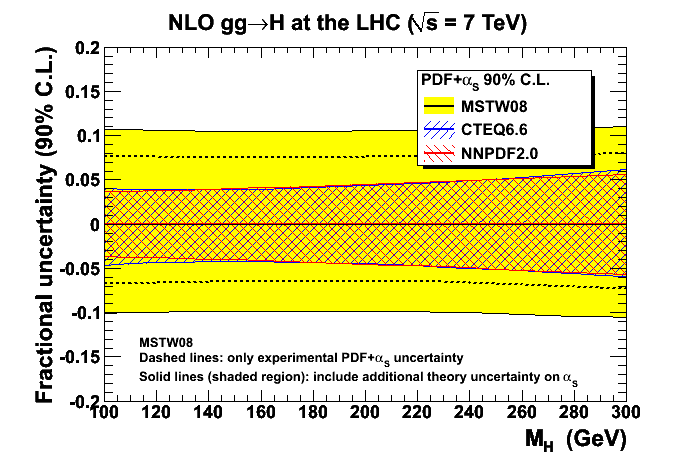
The central predictions in these plots use the values of αS(MZ) favoured by each PDF group, i.e. 0.1202 for MSTW08, 0.1180 for CTEQ6.6 and 0.1190 for NNPDF2.0. The uncertainties on αS(MZ) for CTEQ6.6 and NNPDF2.0 are taken to be ±0.0012 at 68% C.L. and ±0.0020 at 90% C.L. The combined PDF+αS uncertainty is calculated following the prescription recommended by each group, i.e. αS uncertainties are simply added in quadrature for CTEQ6.6, while for NNPDF2.0 the exact prescription is used as explained in arXiv:1004.0962.
For MSTW08, αS(MZ) was determined simultaneously with the PDFs in the global fit, rather than being imposed as an external constraint (as for CTEQ6.6 and NNPDF2.0). The experimental uncertainties on αS(MZ) are +0.0012/-0.0015 at 68% C.L. and +0.0032/-0.0039 at 90% C.L., with an additional one-sigma theory uncertainty estimated to be ±0.003. The prescription for the calculation of the experimental PDF+αS uncertainty was given in arXiv:0905.3531 and is shown by the dashed lines in the above plots. Adding in quadrature the additional contribution due to the theory uncertainty on αS, as recommended in arXiv:1003.4266, gives the full MSTW08 PDF+αS uncertainty band, which is shaded and enclosed by the solid lines in the above plots.
|